All articles with 'zebra lines' Tag
{ 8 Comments }
5 Simple & Useful Conditional Formatting Tricks
Published on Feb 15, 2021 in Learn Excel

Oh, I *LOVE* conditional formatting. It is such a powerful feature. In this post, let me share 5 of my favorite CF secrets with you all.
Continue »{ 3 Comments }
Highlight Quarters, Weekends in pivot reports using styles [quick tip]
Published on Nov 8, 2012 in Excel Howtos, Pivot Tables & Charts
![Highlight Quarters, Weekends in pivot reports using styles [quick tip]](https://img.chandoo.org/pivot/monthly-pivot-reports-with-quarter-highlighting.png)
Here is a quick pivot table tip.
When reporting summaries by month, it would be better to highlight 3 months at a time (Jan, Feb, Mar in one color, Apr, May, Jun in another color) than showing all in one color. Today, lets learn how to do this in easiest possible way.
Continue »{ 14 Comments }
Customize Zebra lines Quickly using Table Styles [tip]
Published on Sep 19, 2012 in Excel Howtos
![Customize Zebra lines Quickly using Table Styles [tip]](https://img.chandoo.org/q/custom-zebra-lines-excel-tip.png)
Zebra lines, the dull highlighting applied to alternative rows is a very good way to make your tables readable & pretty.
We can use either conditional formatting or table formats to quickly add zebra lines to our data.
But what if you want a little more?
What if you want to highlight, lets say 3 rows in one color and 3 in another and repeat this …
Continue »{ 9 Comments }
Christmas Gift Shopping List Template – Set budget, track your gifts using Excel
Published on Nov 23, 2011 in excel apps, Learn Excel
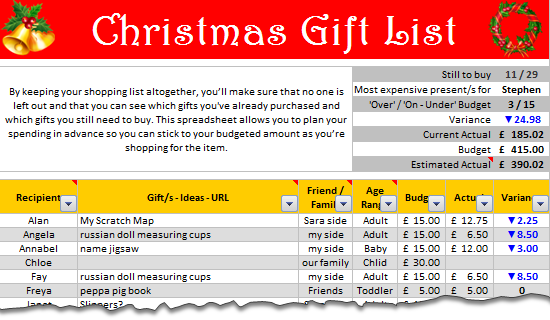
Last year, Steven shared a beautiful Christmas Gift List template with all of us. It is packed with lots of Excel goodness. Just a few days ago, he emailed me another copy of his file with some improvements. So if you are planning for Christmas shopping and want a handy tracker, you don’t want to miss this.
Continue »{ 21 Comments }
How to Filter Odd or Even Rows only? [Quick Tips]
Published on Jan 5, 2011 in Excel Howtos
![How to Filter Odd or Even Rows only? [Quick Tips]](https://chandoo.org/img/q/filtering-odd-or-even-rows-excel-howto-th.png)
Ashish sends out this SOS thru email, “I need your help in putting filters . Can we filter the cells on the basis of their even or odd character. i.e in the table of 1-1000, i wish to filter, 1,3,5,7,…”
An odd request, I must say. But nevertheless, possible in Excel.
Read this quick tip, If you want know how to filter odd or even rows only in a list of values.
Continue »{ 82 Comments }
Show Zebra Lines when Value Changes [Excel Conditional Formatting Homework]
Published on Sep 28, 2010 in Featured, Learn Excel
![Show Zebra Lines when Value Changes [Excel Conditional Formatting Homework]](https://chandoo.org/img/hw/zebra-lines-when-value-changes-excel-conditional-formatting.png)
Here is a quick home work on excel conditional formatting. Lets say you have data as shown below to left and you need to show zebra lines whenever the value changes (see right). Your home work is simple. Just figure out how to write conditional formatting rules to add zebra lines. The data set is […]
Continue »{ 0 Comments }
Excel School Closing in a Few Hours – Join Now!
Published on Jun 21, 2010 in Learn Excel, products

As you may know, I run an online excel training program, called as, Excel School. I have opened registrations for 2nd batch of this program on last Monday. Thank you very much for supporting this program wildly. In a few hours, I will be closing the registrations for Excel School.
Click here to sign up for Excel School
At the time of writing this post (around 9 AM IST on 21st), we have 103 students signed up for Excel School. This is certainly a bit more than what I expected. But, I am also confident and eager to help as many of you as possible. So go ahead and join the program, because, you want to be awesome.
Continue »{ 26 Comments }
Dynamically Grouping Related Events [Excel Combo Charts with Pizzazz]
Published on Aug 27, 2009 in Charts and Graphs
![Dynamically Grouping Related Events [Excel Combo Charts with Pizzazz]](https://chandoo.org/img/n/dynamic-event-grouping-charts-th.gif)
Yesterday we have posted how to use excel combo charts to group related time events. Today we will learn how to change the event grouping dynamically using form controls.
This effect can be easily achieved with a cup of coffee, one combo box form control and the good old IF formula. Read more to learn how to do this.
Continue »{ 10 Comments }
Using Combo Charts to Group Related Time Events [Charting Goodness]
Published on Aug 26, 2009 in Charts and Graphs
![Using Combo Charts to Group Related Time Events [Charting Goodness]](https://chandoo.org/wp/wp-content/uploads/2009/08/excel-combo-chart-th.png)
In his latest book, Now You See It, on pages 165 and 166 of the book, Stephen Few discusses how grouping related time intervals can facilitate analysis of data. As an illustration he explains that when viewing data of daily website visits, it helps in separating weekdays and weekends to differentiate expected traffic during these periods. The use of this technique would make it easier for the analyst to identify any anomalous movement in ether the weekend or the week day.
Fortunately excel combo charts can help you do that. In this guest post, Paresh explains to us how to do this.
Continue »
