All articles with 'quality control' Tag
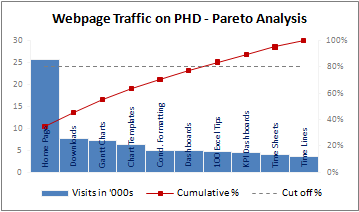
A Pareto chart or pareto graph displays the importance of various factors in decreasing order in columns along with cumulative importance in a line. Pareto charts are often used in quality control to display most common reasons for failure, customer complaints or product defects. The pareto chart is a great way to do the pareto analysis. Today, we will learn how to use excel to make a pareto chart.
Continue »
