All articles with 'olympics' Tag
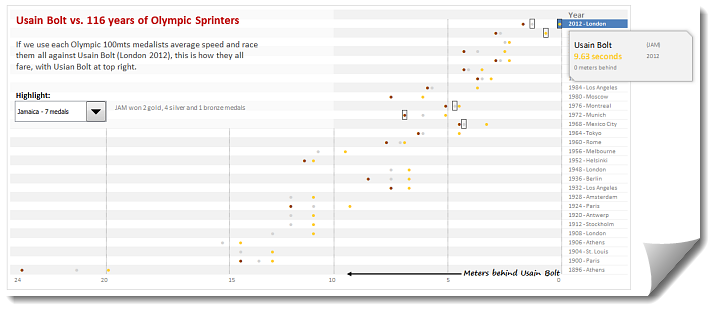
During London 2012 Olympics, Usain Bolt reached the 100mts finish line faster than anyone in just 9.63 seconds. Most of us would be still reading this paragraph before Mr. Bolt finished the race.
To put this in perspective, NY Times created a highly entertaining interactive visualization. Go ahead and check it out. I am sure you will love it.
So I wanted to create something similar in Excel. And here is what I came up with.
Continue »![5 wonderful visualizations you must see [Aug 22]](https://chandoo.org/wp/wp-content/uploads/2008/08/5-awesome-charts-thumb-aug22.jpg)
Every week Pointy Haired Dilbert celebrates the art of chart making by sharing 5 of the most beautiful, innovative and effective infographic ideas from various sites. Click here to see the visualizations featured earlier. Pop, Soda or Coke? – Countywise terms used for sweetened carbonated water The pop-vs-soda map tells how marketers have been effective […]
Continue »
