All articles with 'measures' Tag
{ 27 Comments }
9 Box grid for talent mapping – HR for Excel – Template & Explanation
Published on Nov 17, 2020 in Charts and Graphs, Learn Excel

9 box grid is a popular method for talent mapping. Download this free excel template for tracking and visualizing your employee performance & potential data.
In this article, I explain about powerful excel features like FILTER(), SORT() and CONCATENATEX() to create a similar 9 box talent map grid for your data.
Continue »{ 14 Comments }
Introduction to Power BI – What is it, how to get it, how to create reports with Power BI and how to publish them?
Published on Nov 8, 2019 in Power BI

Power BI is a data analytics & visualization software. It is one of the most popular and powerful way to work with complex business data. In this page, you will find a comprehensive guide to start your Power BI journey.
Continue »{ 6 Comments }
How to conditionally format visuals in Power BI?
Published on Jul 30, 2019 in Power BI

Do you know that you can apply conditional formatting rules to visuals in Power BI? In this post, let’s learn how to conditionally format visuals in Power BI. Something like this:
Continue »
Work in HR and use Power BI? You are going to love this extensive, powerful and useful Employee Turnover Dashboard. In this detailed article, learn how to create your own attrition dashboard system with Power BI. Full example workbook, video and sample data included.
Continue »{ 9 Comments }
Top 5 with above average – Power Pivot Trick
Published on Aug 13, 2018 in Power Pivot

Welcome to Power Mondays. Every Monday, learn all about Power BI, Power Query & Power Pivot in full length examples, videos or tips. In this installment, learn how to get top 5 list with a twist.
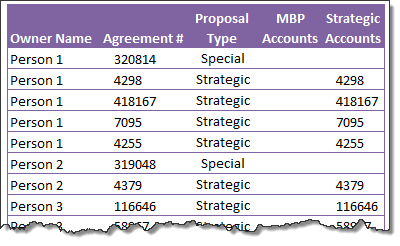
Let’s say you are analyzing sales data and you want to know who are your top 5 sales persons?
Of course, this is simple, you just create a pivot to see total sales by person and then sort the pivot. First five rows have the answer you need. You can even apply a value filter > top 5 to show only their data.
Continue »
![]() Welcome to Power Mondays. Every Monday, learn all about Power BI, Power Query & Power Pivot in full length examples, videos or tips. In the first installment, let’s take a look at something we all can related to – Money.
Welcome to Power Mondays. Every Monday, learn all about Power BI, Power Query & Power Pivot in full length examples, videos or tips. In the first installment, let’s take a look at something we all can related to – Money.
We all know that Power BI is good for creating awesome visual experiences. Today let me share another fun way to use Power BI – to build a calculator. Learn how to create nest egg calculator in this Power BI parameter example tutorial.
Continue »{ 11 Comments }
How to get percentage of something calculations in Excel Pivot Tables
Published on Aug 1, 2018 in Pivot Tables & Charts, Power Pivot

Ever wondered how to get percentage of another value in Excel pivot tables, like this: In this tip, learn how to create such calculations using Excel pivot tables. Note: this tip is not compatible with older versions of Excel. If you are using Excel 2007 / 2010 / 2013, then please install free Power Pivot […]
Continue »
Commonwealth games 2018 have ended in the weekend. Let’s take a look at the games data thru Power BI to understand how various countries performed.
Here is my viz online or you can see a snapshot above.
Looks good, isn’t it? Well, read on to know how it is put together.
Continue »{ 4 Comments }
Last day for enrollments – Join our Power Pivot course & become awesome analyst
Published on Feb 15, 2013 in Power Pivot, products
 Hi folks,
I have a quick announcement & an awesome Power Pivot technique to share with you. First the announcement.
Only few hours left to join our Power Pivot course…
As you may know, I have opened enrollments for our inaugural batch of Power Pivot course few days ago. The aim of this course is to make you awesome in Excel, Advanced Excel, Dashboards & Power Pivot.
We will be closing the doors of this program at midnight, today (11:59 PM, Pacific time, Friday, 15th of February).
If you want to join us, click here and enroll now.
How many people have joined the class?
At the time of writing this, we have 195 students enrolled in Power Pivot class. We are eager to share Power Pivot knowledge & techniques to as many more of you as possible. So go ahead and join us because you want to be awesome in Excel & Power Pivot.
Continue »{ 4 Comments }
Distinct Count & Blanks – Power Pivot Real Life Example
Published on Feb 11, 2013 in Power Pivot
When it comes to analyzing business data, managers are always asking, “so how many distinct x each y is doing?”
And that sends us, data analysts & reporting professionals running from pillar to post figuring out the best way to do it.
- We can use variations of SUMPRODUCT, COUNTIFS etc, but the methods are not flexible..
- We can use VBA, but it would become slow as you add more data.
- We can use Pivot tables, but it only gives half of what we want ie each y part, but not distinct count of x.
- We might as well shave our head with a shovel before manually counting values.
And that brings us to 2 distinctly simple solutions:
- Using Power Pivot & Excel 2010
- Using regular pivot tables in Excel 2013
Today, lets talk about these 2 approaches & see why they are so better than anything else for distinct count situations.
Continue »{ 23 Comments }
Introduction to DAX Formulas & Measures for Power Pivot
Published on Jan 28, 2013 in Power Pivot
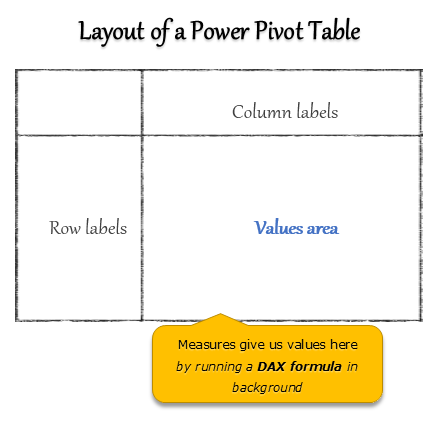
A measure is a formula for the values area of Power Pivot table.
A measure can be implicit or explicit.
Implicit measures are created automatically when you drag and drop a field in to Power Pivot values area. For example, in last week’s introduction, we created an implicit measure for SUM of Sales by dragging and dropping the sales amount field in to values area of our power pivot table.
Explicit measures are created by you using New measure button in Power Pivot tab (or Calculated Field button in Excel 2013 Power Pivot tab). You can also create a measure in the Power Pivot window.
Learn what measures are, how to create them using DAX (Data Analysis Expression) formulas in this video tutorial.
Continue »
