All articles with 'large' Tag
{ 2 Comments }
Visualizing Commonwealth games performance – Interactive chart
Published on Apr 13, 2018 in Charts and Graphs, Power Query

The 2018 edition of Commonwealth games are on for a week now. Both of my homes – India and New Zealand have been doing so well. Naturally, I wanted to gather games data and make something fun and creative from it. Here is my attempt to amuse you on this Friday.
Looks interesting? Want to know how to make something like this on your own? Then read on…
Continue »{ 20 Comments }
5 conditional formatting top tips – Excel basics
Published on Dec 5, 2017 in Excel Howtos, Learn Excel
Time for another round of unconditional love. Today, let’s learn about conditional formatting top tips. It is one of the most useful and powerful features in Excel. With just a few clicks of conditional formatting you can add powerful insights to your data. Ready to learn the top tips? Read on.
Continue »{ 3 Comments }
Analyzing half a million customer complaints – Regional Trends [Part 2 of 3]
Published on Feb 18, 2016 in 3D Maps (Power Maps), Charts and Graphs, Cool Infographics & Data Visualizations
![Analyzing half a million customer complaints – Regional Trends [Part 2 of 3]](https://chandoo.org/wp/wp-content/uploads/2016/02/regional-trends-customer-complaint-vis.png)
This is part two of our three part series on how to analyze half a million customer complaints. Read part 1 here.
Analyzing Regional Trends
As introduced in part 1, our complaints dataset has geographical information too. We know the state & zip code for each complaint. Please note that zip codes are partial or missing for a 10% of the data.
In this article, let’s explore three ways to analyze regional trends.
- Regional trends by state, product & issue
- Complaints per million by state
- Complaints by zip code
{ 4 Comments }
Summarize only filtered values using SUBTOTAL & AGGREGATE formulas
Published on Aug 25, 2015 in Learn Excel

We all know the good old SUM() formula. It can sum up values in a range. But what if you want to sum up only filtered values in a range? SUM() doesn’t care if a value is filtered or not. It just sums up the numbers. But there are other formulas that can pay attention […]
Continue »{ 35 Comments }
Calculate sum of top 10 values [formulas + homework]
Published on Aug 4, 2015 in Formula Challenges, Learn Excel
![Calculate sum of top 10 values [formulas + homework]](https://chandoo.org/wp/wp-content/uploads/2015/08/sum-of-top-10-values-excel.png)
Analyzing top n (or bottom m) items is an important part of any data analysis exercise. In this article, we are going to learn Excel formulas to help you with that.
Let’s say you are the lead analyst at a large retail chain in Ohio, USA. You are looking at the latest sales data for all the 300 stores. You want to calculate the total sales of top 10 stores. Read on to learn the techniques.
Continue »{ 59 Comments }
Excel to the Next Level by Mastering Multiple Occurrences
Published on Dec 9, 2014 in Learn Excel

This is a guest post by Sohail Anwar.
August 29, 1994. A day that changed my life forever. Football World Cup? Russia and China de-targeting nuclear weapons against each other? Anniversary of the Woodstock festival?
No, much bigger: Two Undertakers show up at WWE Summerslam for an epic battle. Needless to say: MIND() = BLOWN().
And thus begun one boy’s journey into understanding the phenomenon of Multiple Occurrences.
My journey continued, when just a few years later my grandfather handed me down a precious family heirloom: A few columns of meaningless data that I could take away and analyze in Excel. You may laugh but in the 90’s, every boy only wanted two things 1) Lists of pointless data and …
Continue »This is a guest post by Krishna, a football lover & one of our readers.
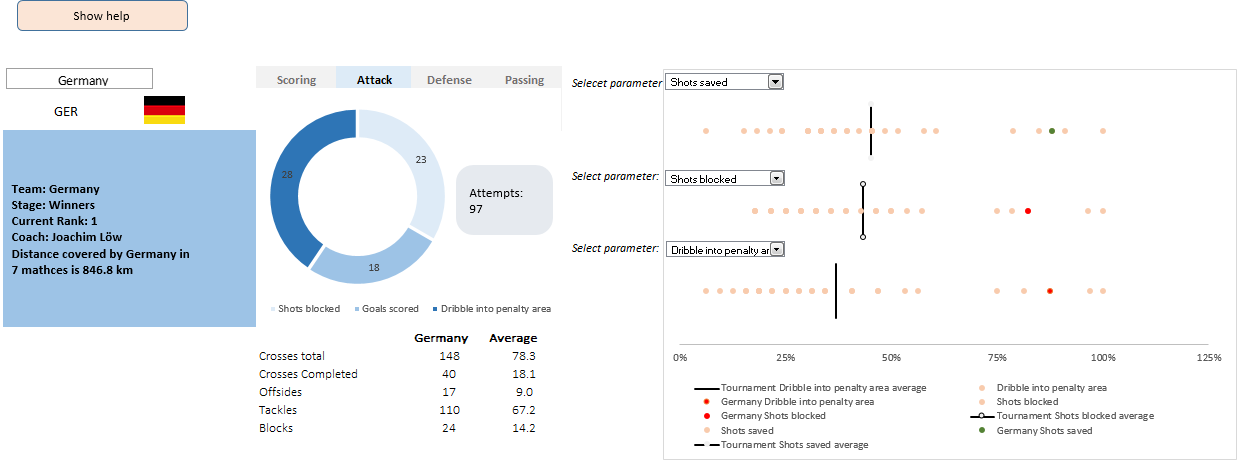
The wait for lifting the most valued priced in football for Germans was finally over. For a football fan, world cup is best time that is scheduled every four years and that if your favorite team lifting the trophy is like your crush is going on a date with you. 🙂
A sneak-peek at the final dashboard
Here is the final dashboard (it has more functionality than depicted). Click on it to enlarge.
{ 17 Comments }
Formula Forensics No. 035 Average the last 3 values greater than 0
Published on Oct 3, 2013 in Formula Forensics, Posts by Hui

Learn a technique to Average the last 3 values from a range where the values are greater than 0
Continue »{ 7 Comments }
Last day for enrollments – Join our Power Pivot class & become awesome analyst
Published on Aug 16, 2013 in Power Pivot
 Hi folks,
I have a quick announcement & a creative dashboard to share with you. First the announcement.
Only few hours left to join our Power Pivot course…
As you may know, I have opened enrollments for our 2nd batch of Power Pivot course few days ago. The aim of this course is to make you awesome in Excel, Advanced Excel, Dashboards, Power Pivot & Advanced Power Pivot.
We will be closing the doors of this program at midnight, today (11:59 PM, Pacific time, Friday, 16th of August).
If you want to join us, click here and enroll now.
Continue »{ 28 Comments }
How to find sum of top 3 values based on filtered criteria [video]
Published on May 17, 2013 in Excel Howtos
![How to find sum of top 3 values based on filtered criteria [video]](https://img.chandoo.org/f/sum-of-top-3-values-meeting-filtered-criteria-excel.png)
Lets say you are looking at some data as shown above and wondering what is the sum of budgets for top 3 projects in East region with Low priority. How would you do that with formulas?
Continue »
Few weeks ago, someone asked me “What are the top 10 formulas?” That got me thinking.
While each of us have our own list of favorite, most frequently used formulas, there is no standard list of top 10 formulas for everyone. So, today let me attempt that.
If you want to become a data or business analyst then you must develop good understanding of Excel formulas & become fluent in them.
A good analyst should be familiar with below 10 formulas to begin with.
Continue »
No, Not that Slash !
How do I find the 4th Slash in a text string?
Today at Formula Forensics we take a look at 4 different methods.
I know I am late to the party, but better late than…, uh! forget it.
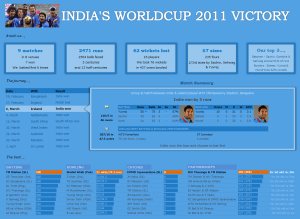
As the keen readers of our blog knew, I like cricket and I show my enthusiasm by making an excel dashboard (or info-graphic) whenever Indian team reaches a major milestone. So naturally, I was super excited when we won the ICC World cup 2011. Last time Indian won the event was in 1983 and my idea of a dashboard at that time was a bottle of milk and jingo-bell, my favorite shake-to-make-annoying-noise toy. I think our latest world-cup victory deserves something more than that. So here we go.
Continue »{ 29 Comments }
Finding 2nd Largest Item in a List that meets a Criteria [Excel Array Formulas]
Published on Oct 8, 2010 in Learn Excel
![Finding 2nd Largest Item in a List that meets a Criteria [Excel Array Formulas]](https://img.chandoo.org/f/2nd-largest-sale-item-array-formula.png)
Excel Array Formulas have subtle beauty and raw power. Today I want to share how you can use Excel Array Formulas to find-out the 2nd largest sale amount corresponding to a particular product.
Lets say you have sales data like this:
Now, we all know that, to get 2nd largest sale amount, we can use the LARGE() formula. Like this: =LARGE(RANGE,2)
But, how do we know what is the 2nd largest sale amount for the product “bricks”?
Continue »{ 103 Comments }
Average of Top 5 Values [and some homework]
Published on Jun 4, 2010 in Featured, Learn Excel
![Average of Top 5 Values [and some homework]](https://chandoo.org/img/f/average-of-top5-values-excel-formula.png)
The other day, while doing consulting for one of my customers, I had a strange problem. My customer has data for several KPIs and she wants to display average of top 5 values in the dashboard. Now, if she wants average of all values, we can use AVERAGE() formula if she wants top 5 values […]
Continue »
