All articles with 'gap width' Tag
{ 24 Comments }
Create a line chart with bands [tutorial]
Published on May 5, 2014 in Charts and Graphs
![Create a line chart with bands [tutorial]](https://img.chandoo.org/c/line-chart-with-bands-to-depict-kpi-or-goals.png)
Here is an interesting scenario.
Imagine you are responsible for customer satisfaction at ACME Inc. Every month you track customer satisfaction rate for the 3 products you sell which are conveniently named Product A, B & C.
You also have bands for the satisfaction rating.
- Rating of 85% or below is Average
- Rating between 85% & 95% is OK
- Rating above 95% is good
At the end of the year, you want to visualize the ratings for last 12 months for 3 products along with bands.
Something like above.
Unfortunately, there is no “Insert Banded line chart” button in Excel. So what to do?
That is what we will learn today. Ready?
Continue »{ 25 Comments }
Sales Funnel Charts in Excel – Tutorial
Published on Jan 9, 2009 in Charts and Graphs, Learn Excel
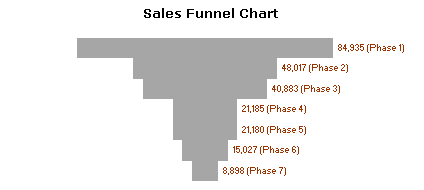
Sales funnel is a very common business chart. Here is a simple bar chart based trick you can use to generate a good funnel chart to be included in that project report.
Continue »
