All articles with 'Excel 2010' Tag
What are Excel Sparklines & How to use them? 5 Secret Tips

Of all the charting features in Excel, Sparklines are my absolute favorite. These bite-sized graphs can fit in a cell and show powerful insights. Edward Tufte coined the term sparkline and defined it as,
intense, simple, word-sized graphics
Sparklines (often called as micro-charts) add rich visualization capability to tabular data without taking too much space. This page provides a complete tutorial on Excel sparklines.
Continue »Creating Customer Service Dashboard in Excel [Part 3 of 4]
![Creating Customer Service Dashboard in Excel [Part 3 of 4]](https://img.chandoo.org/dashboards/constructing-charts-customer-service-dashboard.png)
Welcome back. In third installment of our Customer Service Dashboard series, we will learn how to construct the charts in our dashboard. We will understand the sparklines, traffic lights & dynamic chart setup. To help you learn better, I have recorded a short video too. Go ahead and enjoy.
Continue »How to add your own Macros to Excel Ribbon [quick tip]
![How to add your own Macros to Excel Ribbon [quick tip]](https://img.chandoo.org/q/add-your-own-macros-to-excel-ribbon.png)
Do you know that in Excel 2010 you can create your own Ribbon tabs and add anything to them, including your own macros? Today, we are going to take a look at this useful feature and learn how to add your own macros as buttons to Excel Ribbon. Steps to Add your own macros to […]
Continue »How to create a Win-Loss Chart in Excel? [Tutorial & Template]
![How to create a Win-Loss Chart in Excel? [Tutorial & Template]](https://img.chandoo.org/c/win-loss-chart-excel-template.png)
Win Loss Charts are an interesting way to show a range of outcomes. Lets say, you have data like this:
win, win, win, loss, loss, win, win, loss, loss, win
The Win Loss chart would look like this:

Today, we will learn, how to create Win Loss Charts in Excel.
We will learn how to create Win Loss charts using Conditional Formatting and using In-cell Charts.
Continue »Switch Scenarios Dynamically using Slicers

Slicers are my new favorite feature in Excel. Introduced in Excel 2010, Slicers are like visual filters.
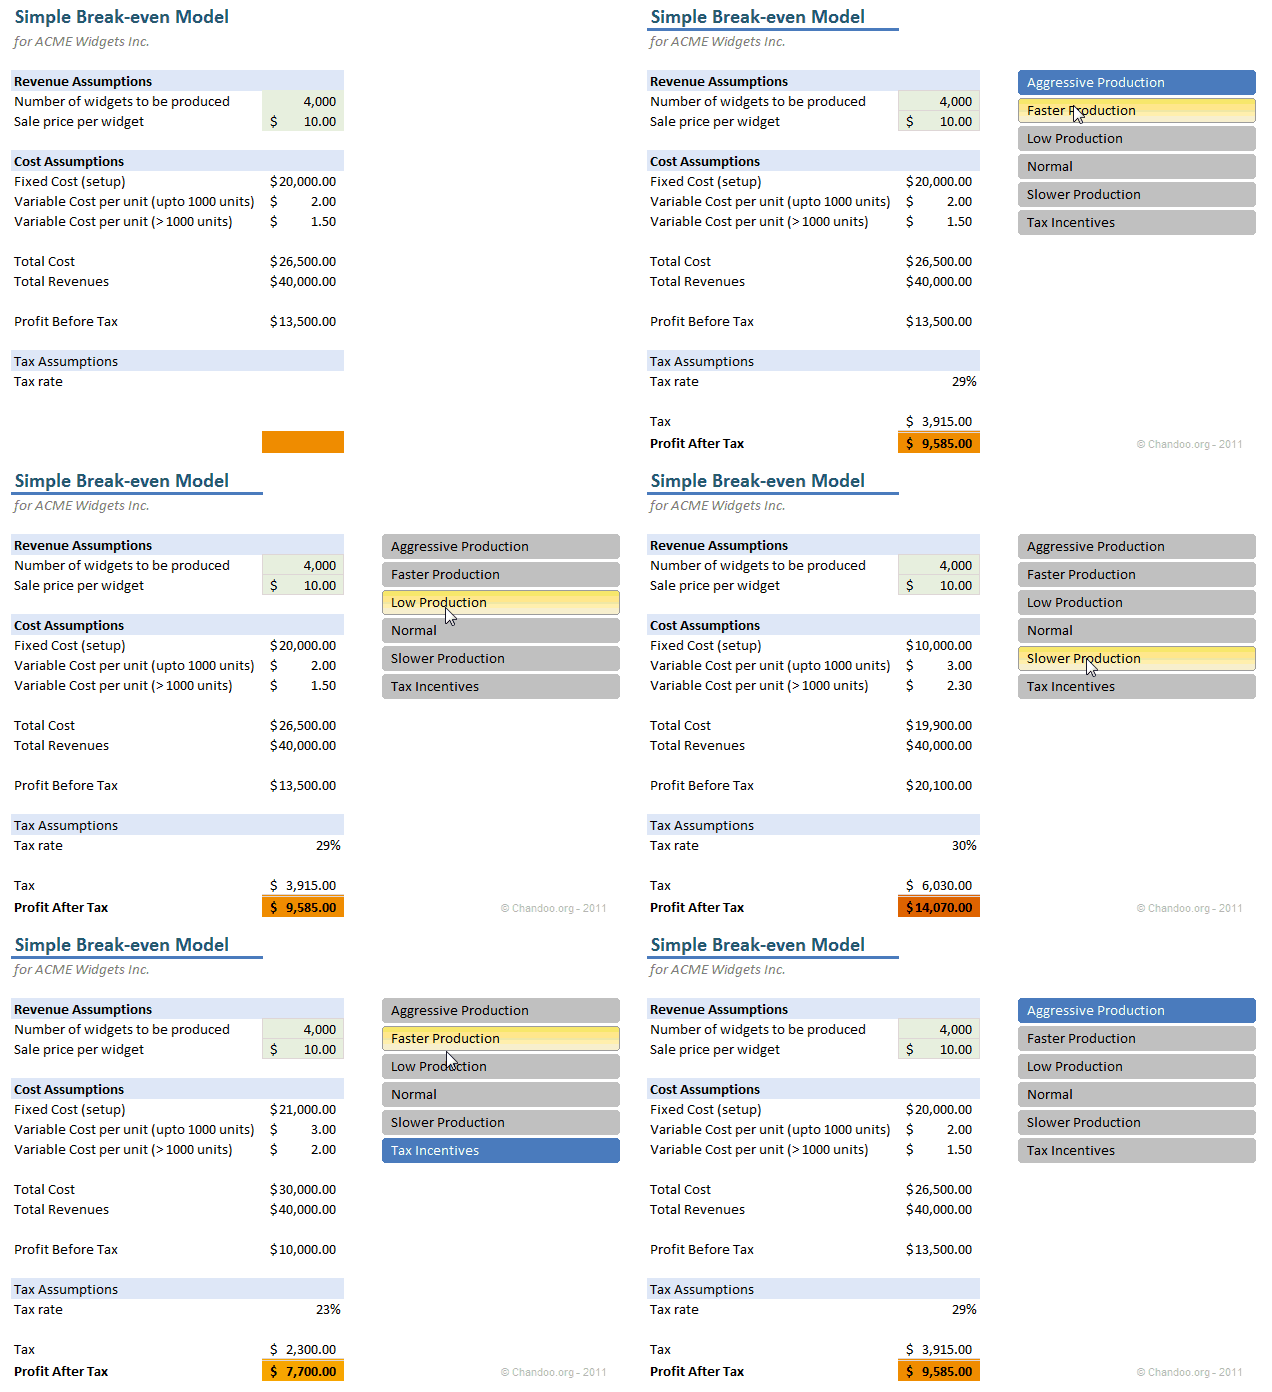
Now, we can use slicers creatively to make an interactive scenario manager in Excel, as you can see below. We will learn how to create this in Excel in today’s post.
Continue »Make Dynamic Dashboards using Pivot Tables & Slicers [Video & Download]
![Make Dynamic Dashboards using Pivot Tables & Slicers [Video & Download]](https://chandoo.org/img/dashboards/dynamic-excel-dashboard-using-pivot-slicers-demo.png)
Do you know that Excel 2010 makes creation of dynamic dashboards very simple?
Yes, that is right. Using slicers feature, you can create dynamic excel dashboards from your data in very little time. Today we are going to learn a technique that will help you create a dashboard like below.
Read rest of this post to find out how to construct a dynamic dashboard in Excel & download the example workbook.
Continue »
We have updates!!! Chandoo.org on Cloud: Everybody and their grandmother is going cloud these days. Although I am quite nebulous about this cloud thing, over the weekend, I mustered some courage and messed with Amazon Cloud Front. I am happy to tell you that Chandoo.org should feel faster and more responsive as I moved some […]
Continue »Understanding Backstage view in Excel 2010

In the last installment of excel 2010 features, we will explore the backstage view (or file menu) in Excel 2010.
Background on Backstage view:
Most of the windows based applications have a File menu. This is the usual place you go to create, open, save, save as, print and close. In Office 2007, Microsoft ditched menu based navigation and introduced Ribbon. They moved all the formatting, pivot, charting, formula, print etc. options to various individual ribbon tabs. But they couldn’t move the functionality of File menu to a separate ribbon. Instead, they moved all this functionality to Office button – a clone of file menu.
Continue »Attend Free Excel Training Session by Me on May 25th

Fantastic news folks… As part of Office 2010 launch, Microsoft India is arranging a virtual launch event on May 25th and 26th. There are a ton of cool sessions on various Office products. I will be presenting on “Sparklines and Conditional Formatting” On May 25th between 3:30 – 5 PM IST (we are GMT + […]
Continue »New Features in Excel 2010 Conditional Formatting
Conditional formatting is one of favorite features in Excel. CF has helped me save the day at work more than a dozen occasions. I almost became project manager just because I knew how to make a gantt chart in excel using conditional formatting. I have written extensively about it.
So, I was naturally curious to explore what is new in Excel 2010’s Conditional Formatting. In this post, I will share some of the coolest improvements in CF.
Continue »What is new in Microsoft Excel 2010? [Office 2010 Week]
![What is new in Microsoft Excel 2010? [Office 2010 Week]](https://chandoo.org/img/2010/excel-2010-whats-new.png)
Office 2010, the latest and greatest version of Microsoft Office Productivity applications is going to be available worldwide in the next few weeks. I have been using Office 2010 beta since November last year and recently upgraded my installation to the RTM version. I was pleasantly surprised when I ran Microsoft Excel 2010 for first time. It felt smooth, fast, responsive and looked great on my comp.
This week, I want to celebrate the launch of Excel 2010 and write about the following new features in Excel 2010.
Also, you can win a copy of Office 2010 – home & student edition by leaving a comment on this or any of the other excel 2010 posts scheduled for this week
Continue »It has been quite a while since we had an excel links post. It doesn’t mean that I am not reading anything new on excel or charting. I have been reading lots of awesome articles and useful content and sharing it on my google reader recommendation list. But it is just that I have been […]
Continue »Sachin Tendulkar ODI Stats – an Excel Info-graphic Poster

Sachin Tendulkar is undoubtedly the best cricketers to play One Day International Cricket. He is a source of inspiration and joy for me and many others. So, naturally I was jumping with joy when I heard that he scored the highest ever runs in a single match on 24th of Feb. He scored 200 runs […]
Continue »What is PowerPivot? (and does it really wear underwear on top of pants !?!)

Along with Excel 2010, Microsoft released a free add-in called PowerPivot. According to MS, PowerPivot gives users the power to create compelling self-service BI solutions, facilitates sharing and collaboration on user-generated BI solutions in a Microsoft SharePoint Server 2010 environment, and enables IT organizations to increase operational efficiencies through Microsoft SQL Server 2008 R2-based management […]
Continue »
Today I want to introduce Excel 2010 to you. Excel 2010 is the latest version of spreadsheet software from Microsoft, set to be released for sale in late 2010. On Nov 18th, MS released the public beta of Excel 2010 [download here] along with other Office productivity software.
Excel 2010 has several improvements compared to earlier version – Excel 2007. In this post, I want to highlight some of the User Interface improvements made in Excel 2010 that are very exciting and fun to use.
Continue »

