All articles with 'conditional formatting icon sets' Tag

Do you manage projects? You are going to LOVE ? this one. In this in-depth tutorial, learn how to create a fully interactive & dynamic Excel Project Management dashboard. Sample files & video instructions are also provided.
Continue »{ 8 Comments }
5 Simple & Useful Conditional Formatting Tricks
Published on Feb 15, 2021 in Learn Excel

Oh, I *LOVE* conditional formatting. It is such a powerful feature. In this post, let me share 5 of my favorite CF secrets with you all.
Continue »{ 46 Comments }
6 Best charts to show % progress against goal
Published on May 8, 2020 in Charts and Graphs, Learn Excel

Back when I was working as a project lead, everyday my project manager would ask me the same question.
“Chandoo, whats the progress?”
He was so punctual about it, even on days when our coffee machine wasn’t working.
As you can see, tracking progress is an obsession we all have. At this very moment, if you pay close attention, you can hear mouse clicks of thousands of analysts and managers all over the world making project progress charts.
So today, lets talk about best charts to show % progress against a goal.
Continue »
Do you run an e-commerce website? You are going to love this simple, clear and easy website metrics dashboard. You can track 15 metrics (KPIs) and visualize their performance. The best part, it takes no more than 15 minutes to setup and use. Here is a preview of the dashboard.
Click to download the template.
Continue »{ 20 Comments }
5 conditional formatting top tips – Excel basics
Published on Dec 5, 2017 in Excel Howtos, Learn Excel
Time for another round of unconditional love. Today, let’s learn about conditional formatting top tips. It is one of the most useful and powerful features in Excel. With just a few clicks of conditional formatting you can add powerful insights to your data. Ready to learn the top tips? Read on.
Continue »![Designing awesome financial metrics dashboard [tutorial]](https://img.chandoo.org/contests/mv2016/rs/09-chandeep-c.png)
In this amazing guest post, the winner of our 2016 dashboard contest – Chandeep – Explains how he constructed the jaw dropping beauty (shown above) using Excel, creativity, love and sweat. Grab a full cup of coffee (or whatever liquid fancies you) and read on. Take lots of notes and play with the ideas in Excel while reading to maximize your learning.
Thanks Chandeep.
Continue »{ 29 Comments }
These icons are so pretty, can I get them in green? [conditional formatting trick]
Published on Mar 22, 2016 in Excel Howtos, Learn Excel
One of our readers emailed this question recently,
I like the conditional formatting icons. I am trying to present some business data where going down is good. How do I get a green colored down arrow icon?
Essentially, Ms. CanIGetItInGreen wants this:
Unfortunately, Excel’s conditional formatting icons are not customizable. So we can’t get the green down arrows without some sneak. And sneak we shall.
Continue »{ 11 Comments }
In-cell 5 star chart – tutorial & template
Published on Aug 15, 2015 in Charts and Graphs, Excel Howtos
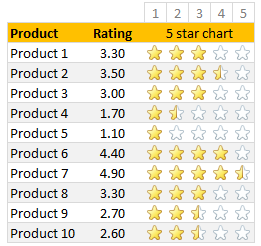
Whenever we talk about product ratings & customer satisfaction, 5 star ratings come to our mind. Today, let’s learn how to create a simple & elegant 5 star in-cell chart in Excel. Something like above.
Read on to learn how to create the above chart.
Continue »Conditional formatting is one of the most powerful & awesome features of Excel. It is very easy to setup. Naturally, people use it extensively. But the default conditional formatting rules can clutter your reports. Here is one tip that can declutter your reports.
Just show the formatting, not values.
See the above report.
Continue »{ 28 Comments }
Ensure cleaner input dates with conditional formatting [quick tip]
Published on May 12, 2015 in Excel Howtos
![Ensure cleaner input dates with conditional formatting [quick tip]](https://chandoo.org/wp/wp-content/uploads/2015/05/cleaner-dates-demo.gif)
Here is a familiar problem: You create a workbook to track some data. You ask your staff to fill up the data. Almost all the input data is fine, except the date column. Every one types dates in their own format. Here is a fun, simple & powerful way to warn your users when they […]
Continue »{ 68 Comments }
There are Easter Eggs in this Excel file!!!
Published on Apr 18, 2014 in Excel Challenges

Hello Friends…,
It is Easter time again. Every year, we at Chandoo.org celebrate Easter by hunting for eggs (not in the wild, just in the Excel workbooks). This year too I have hidden 30 Excel tips in a workbook. You have to solve 3 puzzles to find them. So what are you waiting for. Go ahead and hunt for them eggs.
Click here to download the Easter eggs file.
I am sure you will enjoy them 🙂
Continue »![Project Portfolio Dashboard in Excel [Part 2 of 2]](https://img.chandoo.org/pm/project-portfolio-dashboard-small.png)
In this 2 part tutorial, we will learn how to design a project portfolio dashboard. Part 1 discussed user needs & design. Part 2 will show you Excel implementation.
Project Portfolio Dashboard Pack is now available.
Click here to get your copy.
Click here to get your copy.
Final Implementation – Project Portfolio Dashboard
First lets take a look at the finalized dashboard implementation. Continue reading to learn more & download this dashboard.
Continue »{ 54 Comments }
Show monthly values & % changes in one pivot table
Published on Nov 6, 2012 in Excel Howtos, Pivot Tables & Charts
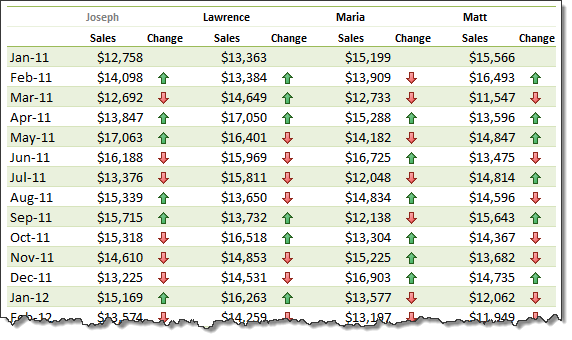
Pivot tables are great help when analyzing lots of data. One of the common questions managers & analysts ask (when looking at monthly sales data for example) is,
How is the monthly performance of our teams (or regions, products etc.)?
A pivot report can answer this question in a snap. Today lets learn how to do that.
Continue »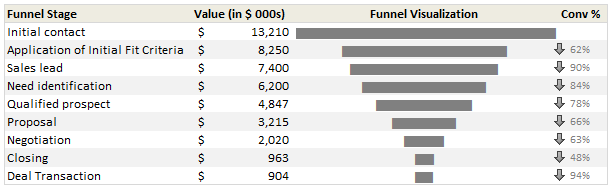
Sales Funnel or Sales Process refers to a systematic approach to selling a product or service. [more on sales process] Whether you run a small business or part of a large corporation, chances are, you heard about Sale Funnel. Understanding & analyzing your sales performance from a Funnel point of view is a great way […]
Continue »{ 12 Comments }
Analyzing Performance of Stocks using Excel [Example]
Published on Sep 21, 2011 in Charts and Graphs
![Analyzing Performance of Stocks using Excel [Example]](https://chandoo.org/wp/wp-content/uploads/2011/09/stock-analysis-in-excel.png)
Last week, we learned how to visualize Suicides vs. Murders data using Interactive charts in Excel. William, one of our readers, took this technique and applied it to Stocks. He emailed me because he has some formula issues with the stock data. Once I solved the problem, I asked him, “Can I share this with […]
Continue »
