All articles with 'Charts and Graphs' Tag
{ 5 Comments }
Win Loss Chart from a Series of Win, Loss Data
Published on Jun 15, 2011 in Charts and Graphs
Last week, we learned how to create win-loss charts in Excel. In the comments, Dan said,
“Incidentally, the fastest way to do this would be using SFE, just reflect your data with 1 for a win, – 1 for a loss. There’s even an option to automatically invert negative numbers.”
Of course, we can use the beautiful Sparklines for Excel addin to do this and several other charts. But if you just have a series of Wins and Losses, like below, you can use a column chart to create win loss charts too.
Today, we will learn how to create a win loss chart from a set of win, loss data in Excel.
Continue »{ 15 Comments }
How to create a Win-Loss Chart in Excel? [Tutorial & Template]
Published on Jun 9, 2011 in Charts and Graphs
![How to create a Win-Loss Chart in Excel? [Tutorial & Template]](https://img.chandoo.org/c/win-loss-chart-excel-template.png)
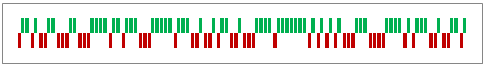
Win Loss Charts are an interesting way to show a range of outcomes. Lets say, you have data like this:
win, win, win, loss, loss, win, win, loss, loss, win
The Win Loss chart would look like this:

Today, we will learn, how to create Win Loss Charts in Excel.
We will learn how to create Win Loss charts using Conditional Formatting and using In-cell Charts.
Continue »
Last week, we have learned what Pivot Table Report Filters are & how to use them.
Today, I am going to show, how you can use simple macro code to change the report filter value dynamically.
We will learn how to create the chart shown here.
Continue »{ 15 Comments }
Comparing Sales of One Product with Another [Excel Techniques]
Published on Apr 25, 2011 in Charts and Graphs
![Comparing Sales of One Product with Another [Excel Techniques]](https://img.chandoo.org/c/comparing-sales-of-one-product-with-another-demo.png)
This is a guest article by Theodor on how to Compare Sales of One Product with Another
Ok, now here’s one for you.
Suppose you’d like to come up with a sales report on different products, comparing their evolution on the same period of different years (say Jan ’09 vs. Jan Jan ’10). At the same time, you’d like to keep an eye on their yearly trend (entire 2009 vs. entire 2010).
Read on to learn how you can use Excel Charts to do this very easily.
Continue »{ 11 Comments }
Excel Teens are out to get you & Other findings from our Survey
Published on Feb 25, 2011 in Charts and Graphs
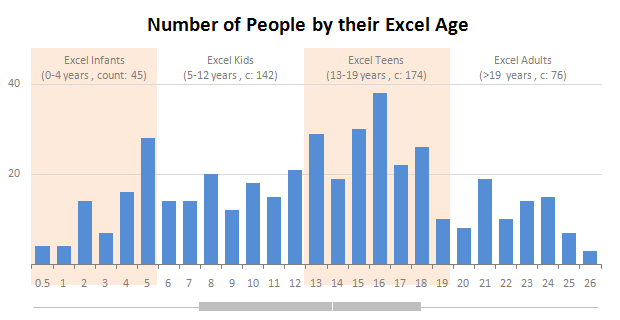
Our of curiosity and fun I asked you “how long have you been using Excel?”. I was overwhelmed by the response we got to this simple question. More than 437 people responded with their comments, stories and enthusiastic responses. Thank you so much.
It would taken me more time to make the charts and understand the data. But thanks to Hui, who volunteered to tabulate all the survey data in a simple CSV.
Shown above is a chart I came up with based on the data. Read the rest of the post to understand the survey results and view more charts. Also, you can download the excel workbooks and original data set to play.
Continue »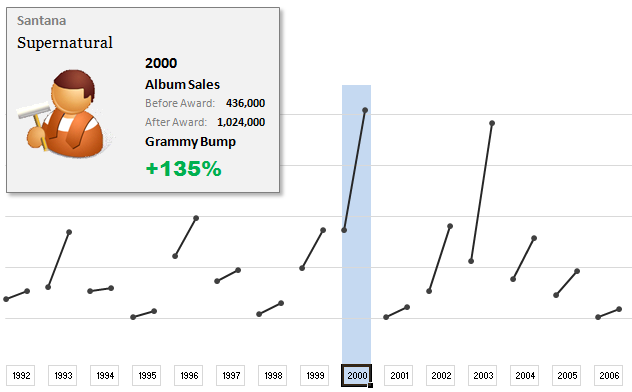
The folks at Washington Post made an interesting chart to understand whether winning a Grammy award makes any difference to album sales. Go ahead and browse it if you have not already seen it. Go, I will wait.
Are you impressed?
I really liked this chart. This is what I liked about the chart,
- It tells a story.
- It is an ego chart. We would all instantly search for our favorite artists and learn about how Grammy award changed their album sales.
- It is a simple chart. No clutter, no gaudy colors, just a bunch of lines and the story is out there.
- It lets you play.
In fact, I liked the chart so much that I wanted to make it in Excel.. You can see a snapshot of what I came up with above. Read the rest of this article to learn more.
Continue »
Often you may have a set of data and need to know what an intermediate or future value of that data may be.
This week we will investigate 3 methods of tackling this problem using Excel.
In this post we’ll look at manual forecasting.

Introducing a method of allowing data points to be interactively highlighted in Excel Scatter / X-Y Charts and Line Charts.
You will see a lot of these style charts in various places where you want to highlight various aspects of the chart to your audience. It is a great technique for complex scientific and engineering charts where you may have hundreds or thousands of points.

Once you start using Excel to develop systems, budget, forecast and large tables of data you may come across the dilemma of “How do I know this is right” or “How do I truth check this”.
This post will add a tool to your arsenal to help you out.
{ 5 Comments }
Excel School Closing in a Few Hours – Join Now!
Published on Sep 29, 2010 in Charts and Graphs, products

As some of you know, I run an online Excel Training Program called as Excel School. I have opened registrations for 3rd batch of this program on September 14th. Thank you very much for supporting this program wildly. In a few hours, I will be closing the registrations for Excel School.
Click here to sign up for Excel School
Read the rest of the post to learn more about Excel School and also download time across world chart template.
Continue »{ 9 Comments }
Official FIFA World-cup Soccer Balls since 1930 in an Excel Chart [Excel Fun]
Published on May 28, 2010 in Charts and Graphs
![Official FIFA World-cup Soccer Balls since 1930 in an Excel Chart [Excel Fun]](https://chandoo.org/img/vp/official-fifa-worldcup-soccer-balls-from-1930.png)
The FIFA World-cup 2010 edition is around the corner. Like millions of people around the world, I too am an ardent fan of football. (although, I have played only one game of soccer in which I waited near opponents goal post as I was too lazy to run around. And when my team mates kicked […]
Continue »{ 7 Comments }
Evolution of Privacy Policies on Facebook – a Panel Chart in Excel
Published on May 13, 2010 in Charts and Graphs, Cool Infographics & Data Visualizations

Out of curiosity I took the data from Matt McKeon’s Privacy on Facebook chart and try to re-do the chart in Excel. I made a panel chart depicting how Facebook’s privacy policies have changed since 2005. You can see a bigger version of chart as well as get the download excel from the post. Read on…
Continue »{ 65 Comments }
Change Data Labels in Charts to Whatever you want [Quick Tip]
Published on May 5, 2010 in Charts and Graphs
![Change Data Labels in Charts to Whatever you want [Quick Tip]](https://chandoo.org/img/q/custom-data-labels-example-chart.png)
We all know that Chart Data Labels help us highlight important data points. When you “add data labels” to a chart series, excel can show either “category” , “series” or “data point values” as data labels.
But what if you want to have a data label that is altogether different, like this:
Of course you can point data labels to any cell. In this quick tip, we will learn how to do this, read on…
Continue »{ 29 Comments }
How to pick a chart type – Charting 101
Published on Apr 19, 2010 in Charts and Graphs
Bar chart or Line? Scatter plot or box plot? These are the questions we ask ourselves when we set out to make a chart. Because, “Selecting right chart for our data” is very important to tell our story.
In this article, we will learn how to “select the right chart” based on our data and situation.
Continue »![How to Visualize Survey Results using Incell Panel Charts [case study]](https://chandoo.org/img/cb/survey-results-panel-chart-example.png)
A panel chart (often called as trellis display or small-multiples) shows data for multiple variables in an easy to digest format. It lets users compare in any way and draw conclusions with ease.
Today, I want to discuss how the principles of panel chart can be applied to visualize a complex set of survey results. For this we will use the recent survey conducted by Gartner on how various customers use BI (Business Intelligence) tools.
Continue »
