All articles with 'Analytics' Tag
{ 14 Comments }
Visualizing Search Terms on Travel Sites – Excel Dashboard
Published on Jan 19, 2009 in Charts and Graphs, Learn Excel
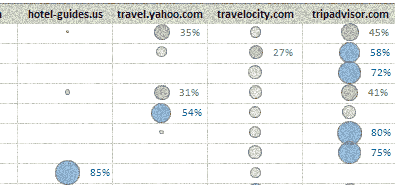
Microsoft excel bubble chart based Visualization to understand how various travel sites compete search terms
Continue »{ 3 Comments }
Featured Visualizations – Jan 09
Published on Jan 10, 2009 in Cool Infographics & Data Visualizations

Check out user journeys and other cool visualizations in this weeks edition.
Continue »{ 175 Comments }
Automatically insert timestamps in excel sheet using formulas
Published on Jan 8, 2009 in Learn Excel

Often when you use excel to track a particular item (like expenses, exercise schedules, investments) you usually enter the current date (and time). This is nothing but timestamping. Once the item is time stamped, it is much more easier to analyze it. Here is an excel formula trick to generate timestamps.
Continue »
Often when you are writing code or testing an application, it might be helpful to have random phone numbers generated for you. Here is an excel formula that I use: =value(left(substitute(rand(),”0.”,””),10)) try these 2 instead (thanks to John) =RAND()*(9999999999-1000000000)+1000000000 =RANDBETWEEN(1000000000,9999999999) [needs analysis toolpack add-in or excel 2007] Even though it works most of the time […]
Continue »{ 18 Comments }
Extracting Unique, Duplicate and Missing Items using Formulas [spreadcheats]
Published on Nov 6, 2008 in Analytics, Learn Excel
![Extracting Unique, Duplicate and Missing Items using Formulas [spreadcheats]](https://chandoo.org/wp/wp-content/uploads/2008/11/duplicate-items-excel-formula-find.gif)
Often I wish Microsoft had spent the effort and time on a data genie (and a set of powerful formulas) that can automate common data cleanup tasks like extracting duplicates, makings lists unique, find missing items, remove spaces etc. Alas, instead they have provided features like clippy which are intrusive to say the least. So […]
Continue »![KPI Dashboards – Compare 2 Decision Parameters [Part 5 of 6]](https://chandoo.org/wp/wp-content/uploads/2008/10/excel-dashboard-visualization-tips-thumb.png)
This is a Guest Post by Robert on Visualization Techniques for KPI Dashboards using Excel. This 6 Part Tutorial on Management Dashboards Teaches YOU: Creating a Scrollable List View in Dashboard Add Ability to Sort on Any KPI to the Dashboard Highlight KPIs Based on Percentile Add Microcharts to KPI Dashboards Compare 2 KPIs in […]
Continue »
Spelling mistakes are a thing of day to day carporate life. Most of the data in spreadsheets is entered by people and hence prone to having spelling mistakes or alternate spellings. For eg. a person named John could have been spelled as Jon. And when John calls you back to confirm his reservation and you […]
Continue »{ 12 Comments }
Sorting a list of items in random order in excel – using formulas
Published on Sep 23, 2008 in Analytics, Learn Excel

In shuffling a list of items in excel I have described the technique of using random numbers generated by RAND() to sort a list of items. The technique had one disadvantage though, every time you need to reshuffle the list you have to press F9 to recalculate the rand() and then go to menu > […]
Continue »![Excel KPI Dashboards – Adding Micro Charts [Part 4 of 6]](https://chandoo.org/wp/wp-content/uploads/2008/09/kpi-dashboard-excel-thumb.jpg)
This is 4th part of Creating Management Dashboards in Microsoft Excel 6 post series by Robert. This 6 Part Tutorial on Management Dashboards Teaches YOU: Creating a Scrollable List View in Dashboard Add Ability to Sort on Any KPI to the Dashboard Highlight KPIs Based on Percentile Add Microcharts to KPI Dashboards Compare 2 KPIs […]
Continue »![KPI Dashboards – Highlight KPIs Based on Percentile [Part 3 or 6]](https://chandoo.org/wp/wp-content/uploads/2008/09/kpi-dashboard-3-thumb.jpg)
Creating KPI Dashboards in Microsoft Excel is a series of 6 posts by Robert from Munich, Germany. This 6 Part Tutorial on KPI Dashboards Teaches YOU: Creating a Scrollable List View in Dashboard Add Ability to Sort on Any KPI to the Dashboard Highlight KPIs Based on Percentile Add Microcharts to KPI Dashboards Compare 2 […]
Continue »Google docs spreadsheet app is going mainstream with each passing day. Recently they have introduced split() formula to divide text in to multiple cells using a user specified delimiter. The syntax for this function is =split(text value, delimeter), for eg. =split(“pointy haired dilbert”, ” “) would result in 3 individual cells with “pointy”, “haired” and […]
Continue »{ 39 Comments }
Doing the NY times Olympic medals by country year visualization in excel
Published on Aug 6, 2008 in Analytics, Charts and Graphs, Cool Infographics & Data Visualizations, Featured, ideas, Learn Excel

When I saw the Olympic medals won by each country by year infographic on nytimes my jaw almost dropped, go ahead see it and come back, I am sure you will love it too. It is one of the coolest visualizations I have seen in the recent past and I see infographics all the time, […]
Continue »{ 36 Comments }
Excel Bullet Graphs
Published on Jul 21, 2008 in Analytics, Charts and Graphs, Featured, hacks, ideas, Learn Excel, technology
Bullet graphs provide an effective way to dashboard target vs. actual performance data, the bread and butter of corporate analytics. Howmuchever effective they are, the sad truth is there is no one easy way to do them in excel. I have prepared a short tutorial that can make you a dashboard ninja without writing extensive […]
Continue »{ 116 Comments }
Bingo / Housie Ticket Generator in Excel
Published on Jul 16, 2008 in Analytics, Learn Excel

I am fascinated by board games. They provide immense fun, anyone can enjoy them, they are unpredictable and best of all they are great value for money. That is why whenever I get sometime I experiment with simulating games to know them better. So, out of curiosity I have created an excel sheet that can generate bingo / housie (housey) tickets – 24 of them at a time. To get new set of tickets you would hit F9 (recalculate).
Continue »I was doing some weird analysis on corporate mission statements and I had to count the number of words in each cell. That is when I realized there is no formula to calculate the number of words in a cell, I was too lazy to write an UDF for that, so I figured out a […]
Continue »
