All articles in 'Featured' Category
![Project Management Dashboard / Project Status Report using Excel [Part 6 of 6]](https://chandoo.org/img/pm/project-status-dashboard-th.png)
Project management dashboards, project status reports help stakeholders, project sponsors and team-members can understand project status very quickly. In the last installment of project management using excel, learn how to make project management dashboard using excel in this tutorial. Also download the excel project status dashboard template.
Continue »{ 22 Comments }
Master Excel 2007 Ribbon with this Free Learning Guide
Published on Sep 17, 2009 in Featured, Learn Excel
Over the last few years, there has been much debate about the merits and perils of Microsoft Ribbon UI in Excel 2007. Personally I think ribbon is a good way to explore an application. I have gotten used to it since I tested excel 2007 for first time. Now, during the rare occasions I work […]
Continue »{ 31 Comments }
Issue Trackers & Risk Management using Excel [Project Management using Excel – Part 5 of 6]
Tracking issues and risks is where most of the project management time goes. Once the project planning and organizing activities are in good shape, most of the project management activities are around risk management and issue tracking. In this installment of project management using excel, we will learn how to create a simple issue tracker template using excel and how to analyze issues using excel.
Continue »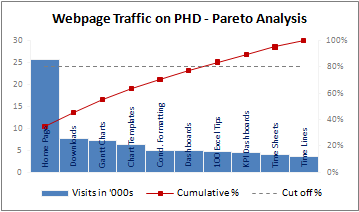
A Pareto chart or pareto graph displays the importance of various factors in decreasing order in columns along with cumulative importance in a line. Pareto charts are often used in quality control to display most common reasons for failure, customer complaints or product defects. The pareto chart is a great way to do the pareto analysis. Today, we will learn how to use excel to make a pareto chart.
Continue »It is no exaggeration that knowing excel formulas can give you a career boost. From someone starting at the long list of numbers, you can suddenly become a data god who can lookup, manipulate and analyze any spreadsheet.
So when our little excel blog hit the 5000 RSS Subscriber milestone, I celebrated the occasion by asking you to share an excel formula through twitter or comments with rest of us. And boy, what an excellent list of formula tips you have shared with us all.
Here is the complete list of entries for the twitter formula contest.
{ 106 Comments }
Waterfall Charts using Excel
Published on Aug 10, 2009 in Charts and Graphs, Featured

Learn how to create waterfall charts in Excel in this tutorial. Our guest author, Aaron, explains how to create cool looking waterfall charts with connectors. Waterfall charts are great, especially for visually showing the contribution of parts to a whole.
Continue »{ 33 Comments }
Excel Time Sheets and Resource Management [Project Management using Excel – Part 4 of 6]
![Excel Time Sheets and Resource Management [Project Management using Excel – Part 4 of 6]](https://chandoo.org/img/pm/timesheets-excel-templates.gif)
Timesheets are like TPS reports of any project. Team members think of them as an annoying activity. For managers, timesheets are a vital component to understand how team is working and where the effort is going. By using Microsoft Excel capabilities you can create a truly remarkable timesheet tracking tool.
In this installment of project management using excel series, we will learn 3 things about timesheets and resource management using Excel
1. How to setup a simple timesheet template in excel?
2. How to make a more robust timesheet tracker tool in Excel?
3. How to use the timesheet data to make a resource loading chart?

In this installment of spreadcheats, we will learn how to use goal seek feature of excel. We will build a retirement savings calculator using excel. We will learn to use Excel’s FV() formula to estimate the corpus that can be accumulated by saving fixed amount every month.
Continue »{ 7 Comments }
Charting Lessons from Optical Illusions
Published on Jul 28, 2009 in Charts and Graphs, Featured

The other day while doing aimless roaming on the dotcom alley, I have seen some cool optical illusions. There are so many valuable lessons optical illusions can teach us – chart makers. Don’t believe me? Look at the bubble chart illusion on the left and tell me which orange circle is bigger? What is your answer? Right or left. Well, my friend, the answer is both are of same size. Read the rest of this post to find some cool optical illusions and what they can teach us – chart makers.
Continue »![Project Management: Show Milestones in a Timeline [Part 3 of 6]](https://chandoo.org/img/pm/project-timeline-chart-excel-th.png)
Learn how to create a timeline chart in excel to display the progress of your project. Timelines are a good way to communicate about the project status to new team members and stake holders. Also, download the excel timeline chart template and make your own timeline charts.
Continue »In today’s installment of project management using excel, we will learn about project tracking tool – to-do lists. Projects are nothing but a group of people getting together and achieving an objective – like building system or constructing a bridge. While it is important to have a overall project plan and vision, it is equally important to understand how various day to day project activities are going on. This is where to do lists can help you a lot. Read on…
Continue »![Gantt Charts – Project Management Using Excel [Part 1 of 6]](https://chandoo.org/img/pm/gantt-chart-project-plan-thumb.png)
This is a 6 part tutorial on project management using microsoft excel. These posts represent few of the things related to project management using excel that I have learned over the years. The first installment deals with Preparing & tracking a project plan using Gantt Charts in MS Excel.
The other parts I am planning are, Day to day operations – using to do lists, Preparing a project time line, Time sheets and Resource management, Tracking issues and risks, Project Status Reporting – Dashboard.
Read the first part of the article to learn how to make excel gantt charts / project plans.
Continue »
Most of us think of mastering formulas, learning macros and being supergood with charts when we think of being productive with spreadsheets. But often learning simple stuff like keyboard shortcuts, using mouse and working with menus and ribbons can be a huge productivity booster for us. So as part of this installment of spreadcheats we […]
Continue »Here is a very quick tip if you ever want to hide a cell’s contents in excel
Just use the custom cell formatting (more here) code ;;;
Continue »{ 67 Comments }
Converting Excel to PDF – Everything you need to know
Published on Jun 4, 2009 in Excel Howtos, Featured

Ok, so you have that neat little excel report ready and now you want to share it with your boss or client in a PDF format. So how would you do that? Your best option is …
Continue »
