Archive for November, 2008
{ 0 Comments }
5 Visualizations for Your Inspiration [Nov 14]
Published on Nov 15, 2008 in Cool Infographics & Data Visualizations
![5 Visualizations for Your Inspiration [Nov 14]](https://chandoo.org/wp/wp-content/uploads/2008/11/dutch-coin-design.jpg)
Every Friday, PHD celebrates the art of chart making by posting 5 beautiful visualizations. These are truly outstanding visualizations providing good information and insights. Browse the last 4 weeks featured items by clicking these links: Visualizations for your inspiration [Nov 04] Must see info-graphics [Oct 31] 5 Beautiful Visualizations [Oct 24] Visualizations of the week […]
Continue »{ 17 Comments }
Seperating digits from a number [excel formulas]
Published on Nov 14, 2008 in Learn Excel
![Seperating digits from a number [excel formulas]](https://chandoo.org/wp/wp-content/uploads/2008/11/dividing-number-to-digits-excel-formula.png)
Reader Joann asks through email: Take the number 117490. I need to break it down5 times: 11749 1174 117 11 1 You can use FLOOR() function to get the desired result, like this: =FLOOR(your-number/10^digit-no,1) See the image below:
Continue »
When I read Is your website’s underwear showing?, I couldn’t control the urge to write this one. So the big screaming friday question everyone… Is your chart’s underwear showing? What is my chart’s underwear? you may ask. My dear reader, it is the background color (that grayish shade excel adds by default). Also commonly known […]
Continue »{ 18 Comments }
How to present changes in Market Share using Charts?
Published on Nov 14, 2008 in Charts and Graphs, Learn Excel
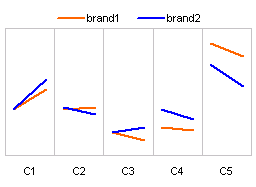
Most of us are comfortable with numbers, but we are confused when it comes to convert the numbers to charts. We struggle finding the right size, color and type of charts for our numbers. The challenge is two fold, we want to make the charts look good (we mean, really… really good) but at the […]
Continue »Hello there … Welcome to Pointy Haired Dilbert or PHD as we call it. Here is a quick intro to the site. What the heck is PHD? PHD is a blog about excel tips, tech tidbits and business insights. Well, mostly excel tips. I write most of the content while a vibrant and passionate community […]
Continue »{ 85 Comments }
Eight ways to exploit COUNTIF() … and sumif() too [spreadcheats]
Published on Nov 12, 2008 in Learn Excel
![Eight ways to exploit COUNTIF() … and sumif() too [spreadcheats]](https://chandoo.org/wp/wp-content/uploads/2008/11/using-countif-excel-help.png)
If for every countif() I write excel paid me a dollar, I would be a millionaire by now. It is such a versatile and fun formula to work with that I have decided to write about it as third post in our spreadcheats series. Using COUNTIF() to replace pivot tables: We all know that you […]
Continue »{ 11 Comments }
Excel Formula for Finding Repeated Words in a Cell
Published on Nov 11, 2008 in Learn Excel

If you ever need to know whether a particular word is repeated in a cell (for eg: a file extension or telephone number or name of the customer) here is how you can find it. =if(lower(cell-with-text)<>SUBSTITUTE(lower(cell-with-text),lower(word-to-check),””,2),”Yes”,”No”) We are using substitute() to replace the second occurance of a particular word and then compare this with original […]
Continue »{ 4 Comments }
Excel Links of the Week – All Downloads at One Place Edition
Published on Nov 10, 2008 in excel links

25+ Excel Templates – Download and Use [plug] Have you ever wondered what it would be like to get all the excel downloadables in Pointy Haired Dilbert in one simple page? Well, I did and created this simple excel templates – download page. It has 27 templates currently and I will add more as and […]
Continue »{ 1 Comment }
5 Visualizations for your Inspiration [Nov 07]
Published on Nov 8, 2008 in Cool Infographics & Data Visualizations
![5 Visualizations for your Inspiration [Nov 07]](https://chandoo.org/wp/wp-content/uploads/2008/11/donations-to-obama-president-thumb.jpg)
Every week Pointy Haired Dilbert features 5 beautiful & creative info-graphic visualizations for your inspiration. I like building, reading and sharing charts and info-graphics and it is a pleasure sharing these with you all. Happy weekend 🙂 Who donated to Obama and how much? This beautiful arc chart shows how much people have donated to […]
Continue »{ 18 Comments }
Extracting Unique, Duplicate and Missing Items using Formulas [spreadcheats]
Published on Nov 6, 2008 in Analytics, Learn Excel
![Extracting Unique, Duplicate and Missing Items using Formulas [spreadcheats]](https://chandoo.org/wp/wp-content/uploads/2008/11/duplicate-items-excel-formula-find.gif)
Often I wish Microsoft had spent the effort and time on a data genie (and a set of powerful formulas) that can automate common data cleanup tasks like extracting duplicates, makings lists unique, find missing items, remove spaces etc. Alas, instead they have provided features like clippy which are intrusive to say the least. So […]
Continue »
Yesterday I have learned this cool excel charting trick and I cant wait to share it with you all. The problem: I have too many charts & want to show one based on selection You have made 3 charts to show your company performance in the last 8 years. But you don’t want to clutter […]
Continue »{ 0 Comments }
US Poll Trackers – Live Dashboards Ooze Visualization Goodness
Published on Nov 5, 2008 in Cool Infographics & Data Visualizations
It is not an easy job to design dashboards for providing up to date information & insights about the most talked about election ever and these sites seem to have done fantastic job. Don’t take my word, just go see them in action. Here is a list of live US poll trackers, dashboards that you […]
Continue »{ 30 Comments }
Relative vs. Absolute References in Formulas [spreadcheats]
Published on Nov 4, 2008 in Learn Excel
![Relative vs. Absolute References in Formulas [spreadcheats]](https://chandoo.org/wp/wp-content/uploads/2008/11/excel-relative-formula-references.gif)
This is the first installment of the spreadcheats series. I have used excel an year and half before I learned about the relative and absolute references. It was such a joyous feeling to find out that you can actually write one (or just a few) formulas and use the power of auto-fill to do the […]
Continue »{ 3 Comments }
Minor Changes to PHD’s Look and Feel
Published on Nov 4, 2008 in blogging, technology
Over the weekend I had sometime to cleanup the CSS and improve page layouts of PHD. The changes are: Post bottoms are hot now! Beneath each post you can now see 2 sets of links. One set with the usual sharing links for you to save the article to delicious or stumble or email it […]
Continue »The World’s First Music Video in Excel ACDC Rock n Roll Train This is totally cool. ACDC released an ASCII version of their “rock n roll train” video through excel spreadsheet. Why? So that you can download it at your office and watch it while your boss thinks you are working. 😀 I think this […]
Continue »
