Archive for October, 2008
{ 32 Comments }
15 MS Excel Tips to Make you a Productivity Guru
Published on Oct 16, 2008 in Featured, Learn Excel
We all like to customize things, to personalize them so that we feel better, faster and smarter using them. Microsoft Excel is a perfect example of highly customizable software. It is simple to learn and use, and at the same time it is relatively easy to change the way it works for you. Here is […]
Continue »{ 2 Comments }
The shower curtain & rings sense of designing products
Published on Oct 15, 2008 in business, wonder why

Last weekend we moved to a new apartment and they didn’t have shower curtain in the bathroom. So yesterday night we went out to buy shower curtain and shower curtain rings. We found a neat shower curtain and a set of rings (2 separate products). We bought them and got home. I unpacked the rings […]
Continue »{ 32 Comments }
More than 3 Conditional Formats in Excel
Published on Oct 14, 2008 in Charts and Graphs, Learn Excel

One of the most popular posts on this blog is how to become excel conditional formatting rock star. Quite a few commenters there asked me if there is a way to get more than 3 (or 4) conditional formats in excel 2003. Like what you see below: You can get more than three conditional formats […]
Continue »{ 2 Comments }
Excel Links of the Week – The Mt. Rainier edition
Published on Oct 13, 2008 in excel links
We drove down to one of the Washington’s best attractions. The Mt. Rainier National Park. It is one of the best natural attractions I have ever seen. The mountain, the greenery and the drive are totally awesome. The mountain looked breathtakingly beautiful and the whole park looked awesome with fall colors. Do visit Mt. Rainier […]
Continue »{ 0 Comments }
Windows 98 – Photographic Fridays #17
Published on Oct 11, 2008 in america, photographic fridays

Downtown is full of buildings and windows, each window reflecting other buildings making the whole thing look gorgeous. I took this in Pittsburgh (I know, very few pics since we moved to Seattle. Nothing wrong with the place, it is an amateur photographers heaven, I haven’t found enough time since we are staying in hotel […]
Continue »{ 1 Comment }
Visualizations of the Week [Oct 10]
Published on Oct 10, 2008 in Charts and Graphs, Cool Infographics & Data Visualizations
![Visualizations of the Week [Oct 10]](https://chandoo.org/wp/wp-content/uploads/2008/10/rocking-news-paper-visualization.jpg)
Every Friday PHD celebrates the art of chart making by showcasing some of the best visualizations around the web. See some of the awesome visualizations featured earlier. World Map Cartogram – Country Area by Population How would the world look like if each country had area proportionate to its population? The above seen cartogram is […]
Continue »![KPI Dashboards – Compare 2 Decision Parameters [Part 5 of 6]](https://chandoo.org/wp/wp-content/uploads/2008/10/excel-dashboard-visualization-tips-thumb.png)
This is a Guest Post by Robert on Visualization Techniques for KPI Dashboards using Excel. This 6 Part Tutorial on Management Dashboards Teaches YOU: Creating a Scrollable List View in Dashboard Add Ability to Sort on Any KPI to the Dashboard Highlight KPIs Based on Percentile Add Microcharts to KPI Dashboards Compare 2 KPIs in […]
Continue »
In Petal Charts – an Alternative to Radar Charts I have suggested using a radar chart tweak to replace the radar charts. Both PTSBlog and Information Ocean have posted their critical reviews of these petal charts. So as a penance for proposing petals, I am going to provide a tutorial on creating a comparison table […]
Continue »{ 21 Comments }
Red vs. Blue – 35 Cool Visualizations on 2008 US Presidential Election
Published on Oct 7, 2008 in america, Charts and Graphs, Cool Infographics & Data Visualizations, Featured
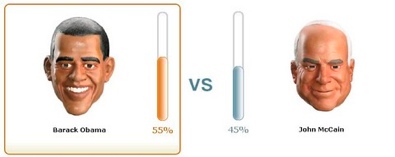
With 2008 US Presidential elections around the corner everyone is busy including chart makers. There are hundreds of excellent visualizations on the presidential election campaign, speeches, issues, predictions that keeping track of what is best can be a tough task. We at PHD have compiled a list of 35 totally awesome visualizations on the 2008 […]
Continue »What a Monday it is. Most of the us woke up to find that whatever we have been accumulating for the last few years in investment gains has been wiped out (BSE Sensex at 2 year low, Dow slips below 10000). Not a very pleasant way to start the week, but then may be this […]
Continue »{ 4 Comments }
Major Updates to Google Docs Spreadsheets App – Menus, Named Ranges, Toolbar
Published on Oct 6, 2008 in Learn Excel, technology
Google Docs – spreadsheet application has introduced some major upgrades to their editor today. Some of the key changes include: Introduction of menus to access all spreadsheet functions / features by category: Now the spreadsheet app menus look more like Excel 2003 menus. Looks like Google is trying hard to close gap between the two […]
Continue »{ 2 Comments }
Come, Lets Celebrate – Photographic Fridays # 16
Published on Oct 4, 2008 in america, photographic fridays

That is Pittsburgh downtown from Mt. Washington during the night time. It looked like a huge party down there.
Continue »{ 8 Comments }
Deal or No Deal – Download and Play the Popular TV Game Show in Excel
Published on Oct 3, 2008 in Learn Excel, simulation
Ever since we moved to Seattle we have been watching TV game show – Deal or No Deal (for lack of better things to do in the hotel) The game provides an interesting look at human nature and risk taking abilities. People who wouldn’t risk their retirement savings or jobs would go to these game […]
Continue »{ 4 Comments }
Info-graphics of the week [Oct 3]
Published on Oct 3, 2008 in Cool Infographics & Data Visualizations
Every week Pointy Haired Dilbert celebrates the art of visualization by featuring 5 of the coolest and most awesome visualizations floated around the web. Click here to browse the full archives of featured cool infographics. US Electoral College Vote Prediction Tracker – Cool Interactive Visualization With each media house providing its own predictions on the […]
Continue »{ 13 Comments }
Display decimals only when the number is less than 1 [Excel number formatting tip]
Published on Oct 2, 2008 in Learn Excel
![Display decimals only when the number is less than 1 [Excel number formatting tip]](https://chandoo.org/wp/wp-content/uploads/2008/10/number-formatting-tip-conditionally-showing-decimals.png)
Here is a quick excel number formatting tip. If you ever want to format numbers in such a way that it shows decimal values only if the number is less than 1 you can use conditional custom cell formatting (do not confuse with conditional formatting). Here is an example: In such cases you can use […]
Continue »
