Yvonne Love
Member
Hi all,
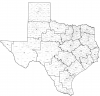
I actually am assuming there isn't a way to accomplish this, but I thought it wouldn't hurt to ask. In Texas, we have Regions (as seen on the attached map - dark line borders), and I would like to be able to fill the regions as either a heat map or even be able to fill individual regions to the level equivalent of how many clients we have in that region (if there are 100 clients in one region, and we have 75 of them, I'd like the region to be 75% full). I'm not even sure this is possible and it is probably just a pipe dream, but I know Excel is pretty amazing, so I thought I would ask the experts.
Thank you in advance!!
YL