John()
Member
Did you post in last few days looking for Top20 (from your Data), i was looking at that thread and as i was interested in it i checked out the answer you got and downloaded it to see how it was done,
as im learning excel i found this a great way to learn how to take data from multiple sheats and display them on another sheath.
the person who replied and helped you did a great job and after studying what he did i eventually figured out how his formula worked and how he put everything together.
But i have found a little problem that got over looked ... and its very common when dealing with this type of problem from what i have seen in my studies.
unfortunately i am after searching for the post and i cannot find it to post in it so im posting here incase you or someone who might know of the post can point me to it.
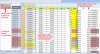
ok to the problem i found ... you were looking to have your data placed in a dashboard kind of layout ... that someone could look at a list for different months and see the top 20 sellers (think they were sellers) from list of over 6000 per month
Problem is your list contains duplicates ... in some cases 3 sets ... so instead of getting 20 different results you are getting in some cases only 15 and other 5 are duplicates and missing people that should have being in the list.
i have attached a image showing what i mean ..... and all that is required to sort it out is to create a helper colum on each of your data sheats to give the top 20 unique numbers
anyway hope its not a problem posting this ... as i had intended to only look at the problem to see how it was sorted and to learn from the answer ... but after finding the issue thought it be best the post in case the original poster didnt realise he was getting duplicates in his results.
as im learning excel i found this a great way to learn how to take data from multiple sheats and display them on another sheath.
the person who replied and helped you did a great job and after studying what he did i eventually figured out how his formula worked and how he put everything together.
But i have found a little problem that got over looked ... and its very common when dealing with this type of problem from what i have seen in my studies.
unfortunately i am after searching for the post and i cannot find it to post in it so im posting here incase you or someone who might know of the post can point me to it.
ok to the problem i found ... you were looking to have your data placed in a dashboard kind of layout ... that someone could look at a list for different months and see the top 20 sellers (think they were sellers) from list of over 6000 per month
Problem is your list contains duplicates ... in some cases 3 sets ... so instead of getting 20 different results you are getting in some cases only 15 and other 5 are duplicates and missing people that should have being in the list.
i have attached a image showing what i mean ..... and all that is required to sort it out is to create a helper colum on each of your data sheats to give the top 20 unique numbers
anyway hope its not a problem posting this ... as i had intended to only look at the problem to see how it was sorted and to learn from the answer ... but after finding the issue thought it be best the post in case the original poster didnt realise he was getting duplicates in his results.
")